They are constructions distributed throughout the Doñana National Park, which have electrical autonomy, network connectivity and some sensors or instruments related to hydrological and meteorological variables.
They look like this:
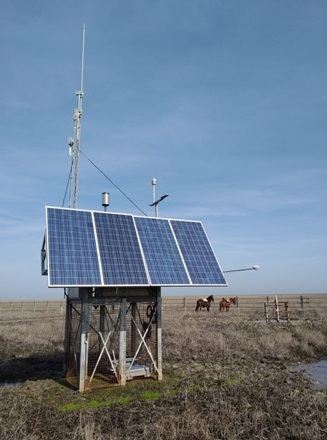
These constructions allow us to obtain and store measurements with a frequency of one data every 5 minutes.
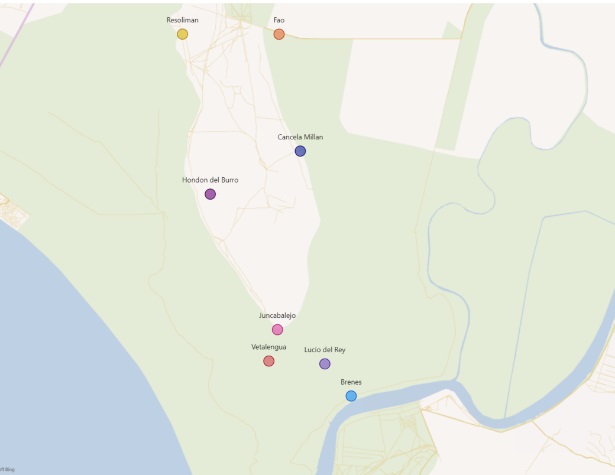
Back to topThe Hidromet Stations are distributed as follows throughout the Doñana National Park:
 Back to top
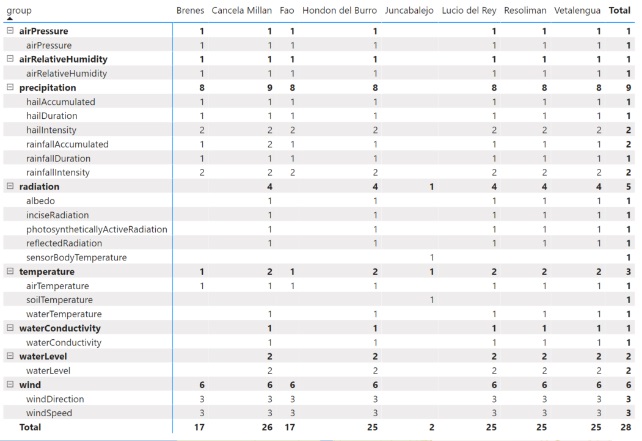
List of groups of variables and variables measured by each Station:
The aggregated method data according to the 'Calculation Method' are the following:
| Variable Group | Variable | Variable-Instrument-Calculation Method | Aggr Method |
|---|---|---|---|
| airPressure | airPressure | airPressure_VaisalaMeteo_Average | Average Maximum Minimum |
| airRelativeHumidity | airRelativeHumidity | airRelativeHumidity_VaisalaMeteo_Average | Average Maximum Minimum |
| precipitation | hailAccumulated | hailAccumulated_VaisalaMeteo_Totalize | Totalize |
| precipitation | hailDuration | hailDuration_VaisalaMeteo_Totalize | Totalize |
| precipitation | hailIntensity | hailIntensity_VaisalaMeteo_Maximum | Maximum |
| precipitation | hailIntensity | hailIntensity_VaisalaMeteo_Average | Average |
| precipitation | rainfallAccumulated | rainfallAccumulated_RainGaugeYoung-52203_Totalize | Totalize |
| precipitation | rainfallAccumulated | rainfallAccumulated_VaisalaMeteo_Totalize | Totalize |
| precipitation | rainfallDuration | rainfallDuration_VaisalaMeteo_Totalize | Totalize |
| radiation | albedo | albedo_AlbedoKippZonenCMA11_Average | Average |
| radiation | incidentRadiation | incidentRadiation_AlbedoKippZonenCMA11_Average | Average |
| temperature | airTemperature | airTemperature_VaisalaMeteo_Average | Average Maximum Minimum |
| wind | windDirection | windDirection_VaisalaMeteo_Average | Mode |
| wind | windSpeed | windSpeed_VaisalaMeteo_Average | Average |
Each raw measurement is processed using one of these statistical methods before being stored as aggregated data.
The arithmetic mean of all raw values within the aggregation period. Used for continuous variables like temperature, pressure and humidity.
The highest individual value observed within the period. Useful for peak measurements like maximum temperature or maximum wind speed.
The lowest individual value observed within the period. Typically used alongside Maximum to capture the full range of a variable.
The sum of all raw values within the period. Used for cumulative variables like rainfall or hail accumulation, where the total amount matters.
The most frequently occurring value within the period. Used for directional data like wind direction, where averaging angles would be misleading.